

A culture of innovation fuels business resilience and economic recovery in Malaysia
March 11, 2021
Securing industrial networks: What is ISA/IEC 62443?
March 12, 2021Threat Trends: DNS Security, Part 1

Part 1: Top threat categories
When it comes to security, deciding where to dedicate resources is vital. To do so, it’s important to know what security issues are most likely to crop up within your organization, and their potential impact. The challenge is that the most active threats change over time, as the prevalence of different attacks ebb and flows.
This is where it becomes helpful to know about the larger trends on the threat landscape. Reading up on these trends can inform you as to what types of attacks are currently active. That way, you’ll be better positioned to determine where to dedicate resources.
Our Threat Trends blog series takes a look at the activity that we see in the threat landscape and reports on those trends. After examining topics such as the MITRE ATT&CK framework, LOLBins, and others, this release will look at DNS traffic to malicious sites. This data comes from Cisco Umbrella, our cloud-native security service.
We’ll briefly look at organizations as a whole, before drilling down into the number of endpoints connecting to malicious sites. We’ll also look at malicious DNS activity—the number of queries malicious sites receive.
Overall, this can provide insight into how many malicious email links users are clicking on, how much communication RATs are performing, or if cryptomining activity is up or down. Such information can inform on where to dedicate resources, such as topics requiring security training or areas to build threat hunting playbooks.
Overview of analysis
We’ll look at DNS queries to domains that fall into certain categories of malicious activity, and in some cases specific threats, between January and December of 2020. While performing this analysis we looked at a wide variety of threat trends. We’ve chosen to highlight those that an organization is most likely to encounter, with a focus on the categories that are most active.
It’s worth noting that we’re deliberately not making comprehensive comparisons across categories based on DNS activity alone. The fact is that different threat types require varying amounts of internet connectivity in order to carry out their malicious activities. Instead, we’ll look at individual categories, with an eye on how they rise and fall over time. Then we’ll drill further into the data, looking at trends for particular threats that are known to work together.
For more information on our methodology, see the Methodology section at the end of this blog.
Organizations and malicious DNS activity
To start off, let’s look at organizations and how frequently they see traffic going to sites involved in different types of malicious DNS activity. The following chart shows the percentage of Cisco Umbrella customers that encountered each of these categories.

To be clear, this does not indicate that 86 percent of organizations received phishing emails. Rather, 86 percent of organizations had at least one user attempt to connect to a phishing site, likely by clicking on a link in a phishing email.
Similar stories present themselves in other categories:
- 70 percent of organizations had users that were served malicious browser ads.
- 51 percent of organizations encountered ransomware-related activity.
- 48 percent found information-stealing malware activity.
Let’s take a closer look at some of the more prevalent categories in further detail, focusing on two metrics: the number of endpoints alerting to malicious activity (depicted by line graphs in the following charts), and the amount of DNS traffic seen for each type of threat (shown by bar graphs in the charts).
Cryptomining
It’s not surprising that cryptomining generated the most DNS traffic out of any individual category. While cryptomining is often favored by bad actors for low-key revenue generation, it’s relatively noisy on the DNS side, as it regularly pings mining servers for more work.
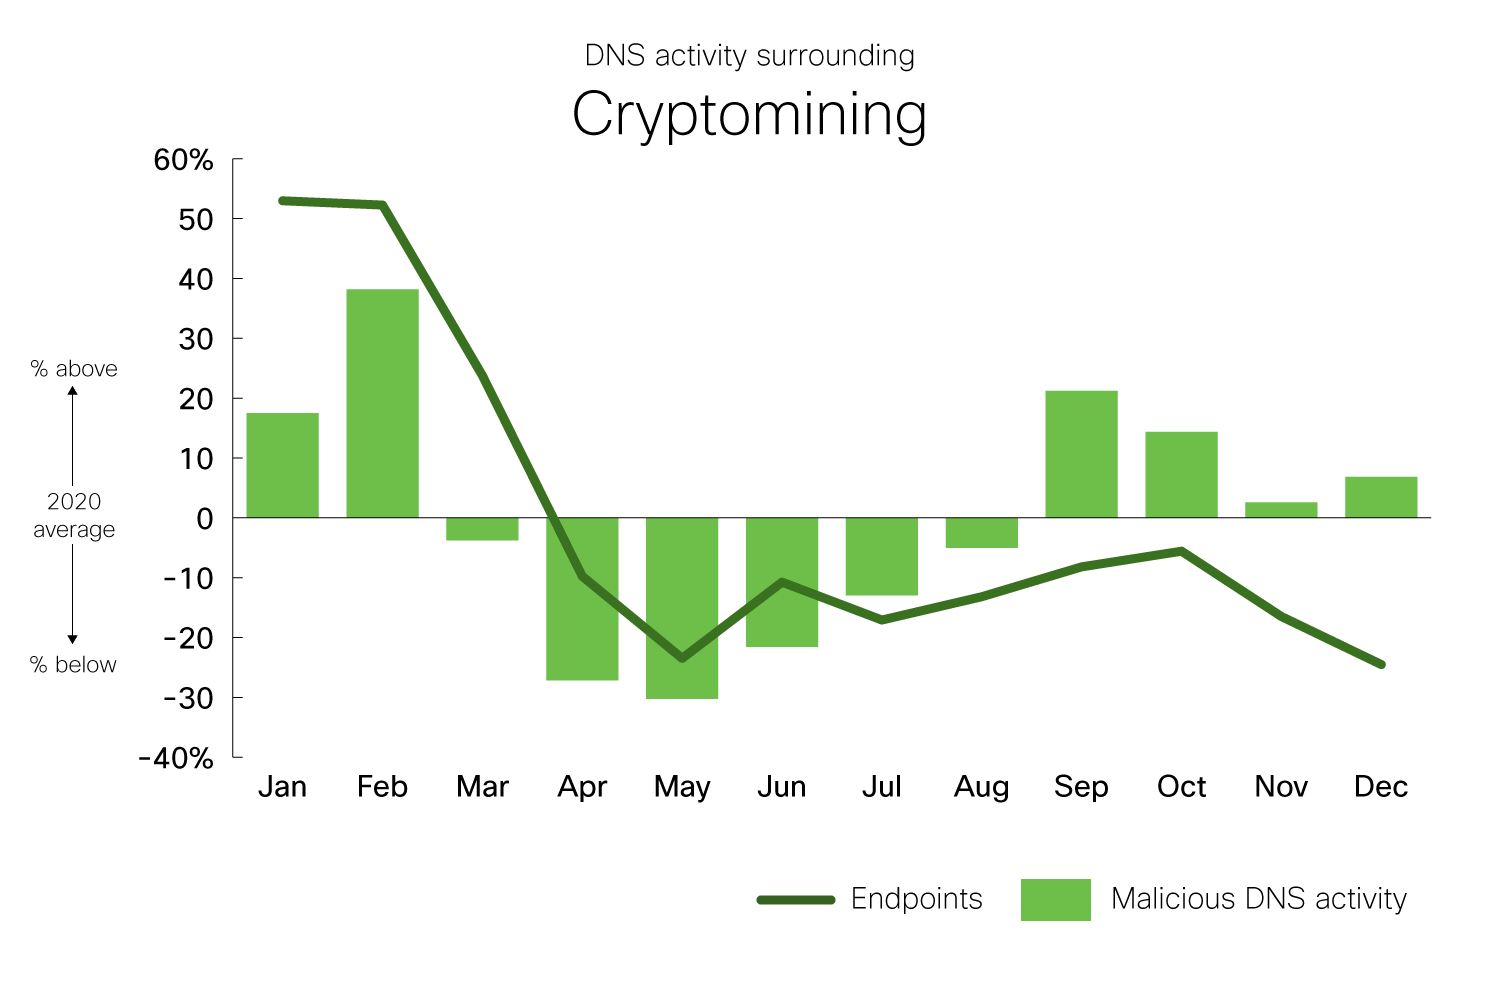
Cryptomining was most active early in the year, before declining until summer. This, and the gradual recovery seen in the later part of the year, largely tracks with the value of popular cryptocurrencies. As currency values increased, so too did the rate of activity. For example, researchers in Cisco Talos noticed an increase in activity from the Lemon Duck threat starting in late August.
It’s also worth noting that there’s little difference there is between “legitimate” and illicit cryptomining traffic. Some of the activity in the chart could be blocks based on policy violations, where end users attempted to mine digital currencies using company resources. In cases like this, administrators would have good reason for blocking such DNS activity.
Phishing
The amount of phishing-related DNS activity was fairly stable throughout the year, with the exception of December, which saw a 52 percent increase around the holidays. In terms of the number of endpoints visiting phishing sites, there were significant increases during August and September.
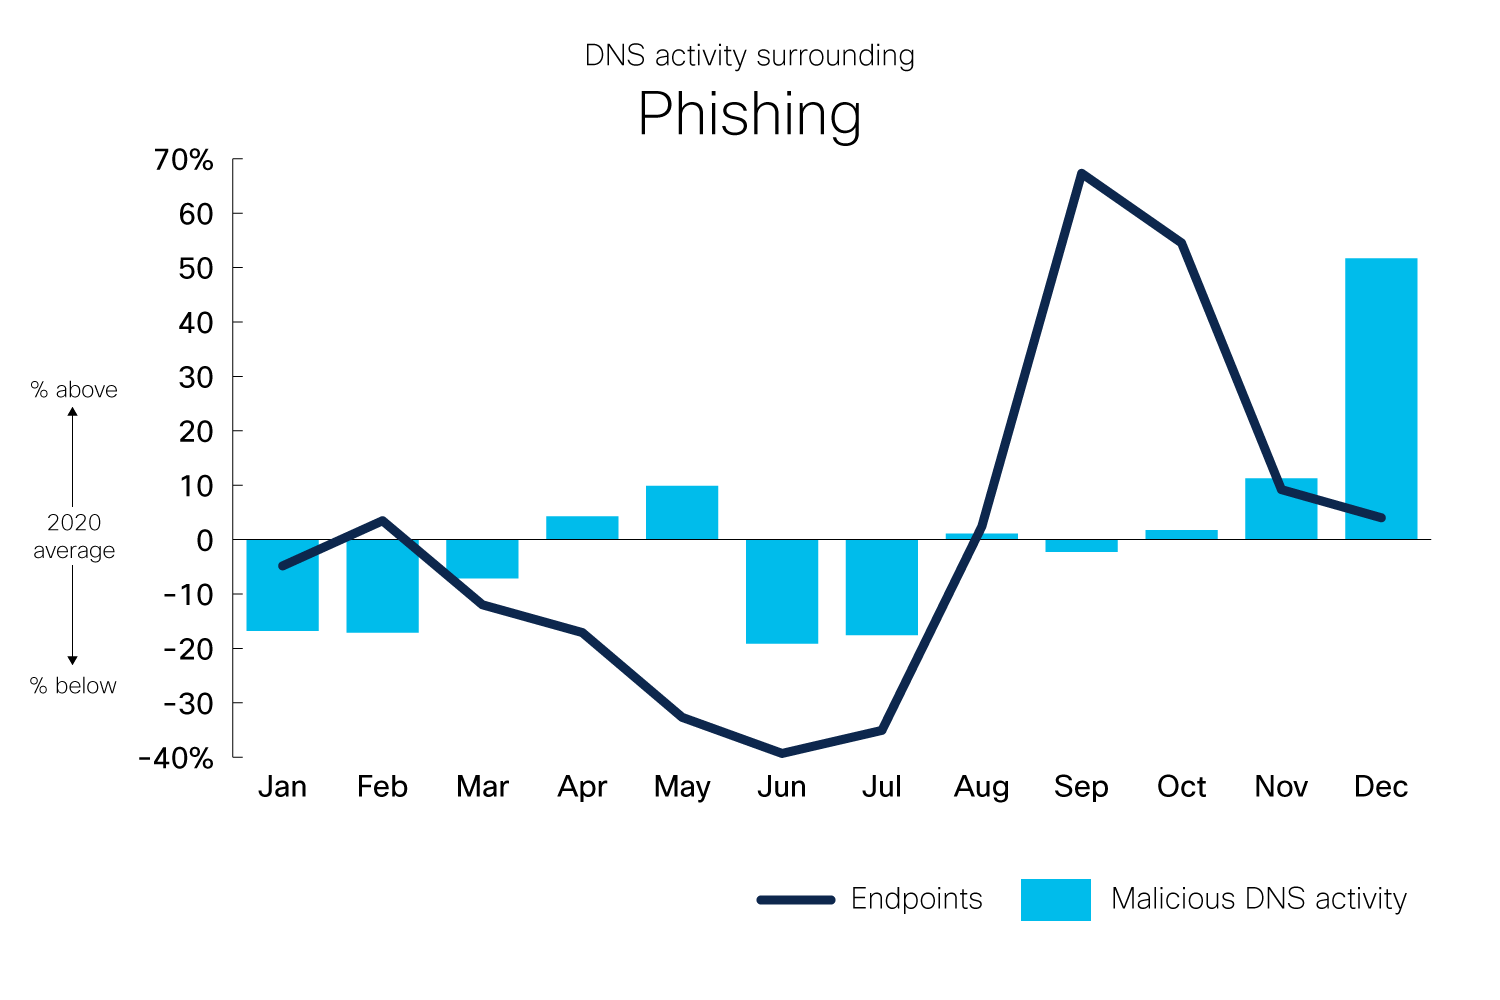
This is due to a very large phishing campaign, where we see a 102 percentage-point shift between July and September. More on this later, but for now, take note of the point that dramatically more endpoints began clicking on links in phishing emails.
Trojans
Similar to cryptomining, Trojans started the year strong. The incredibly high number of endpoints connecting to Trojan sites was largely due to Ursnif/Gozi and IcedID—two threats known to work in tandem to deliver ransomware. These two threats alone comprised 82 percent of Trojans seen on endpoints in January.
 However, the above-average numbers from January were likely tied to a holiday-season campaign by attackers, and declined and stabilized as the year progressed.
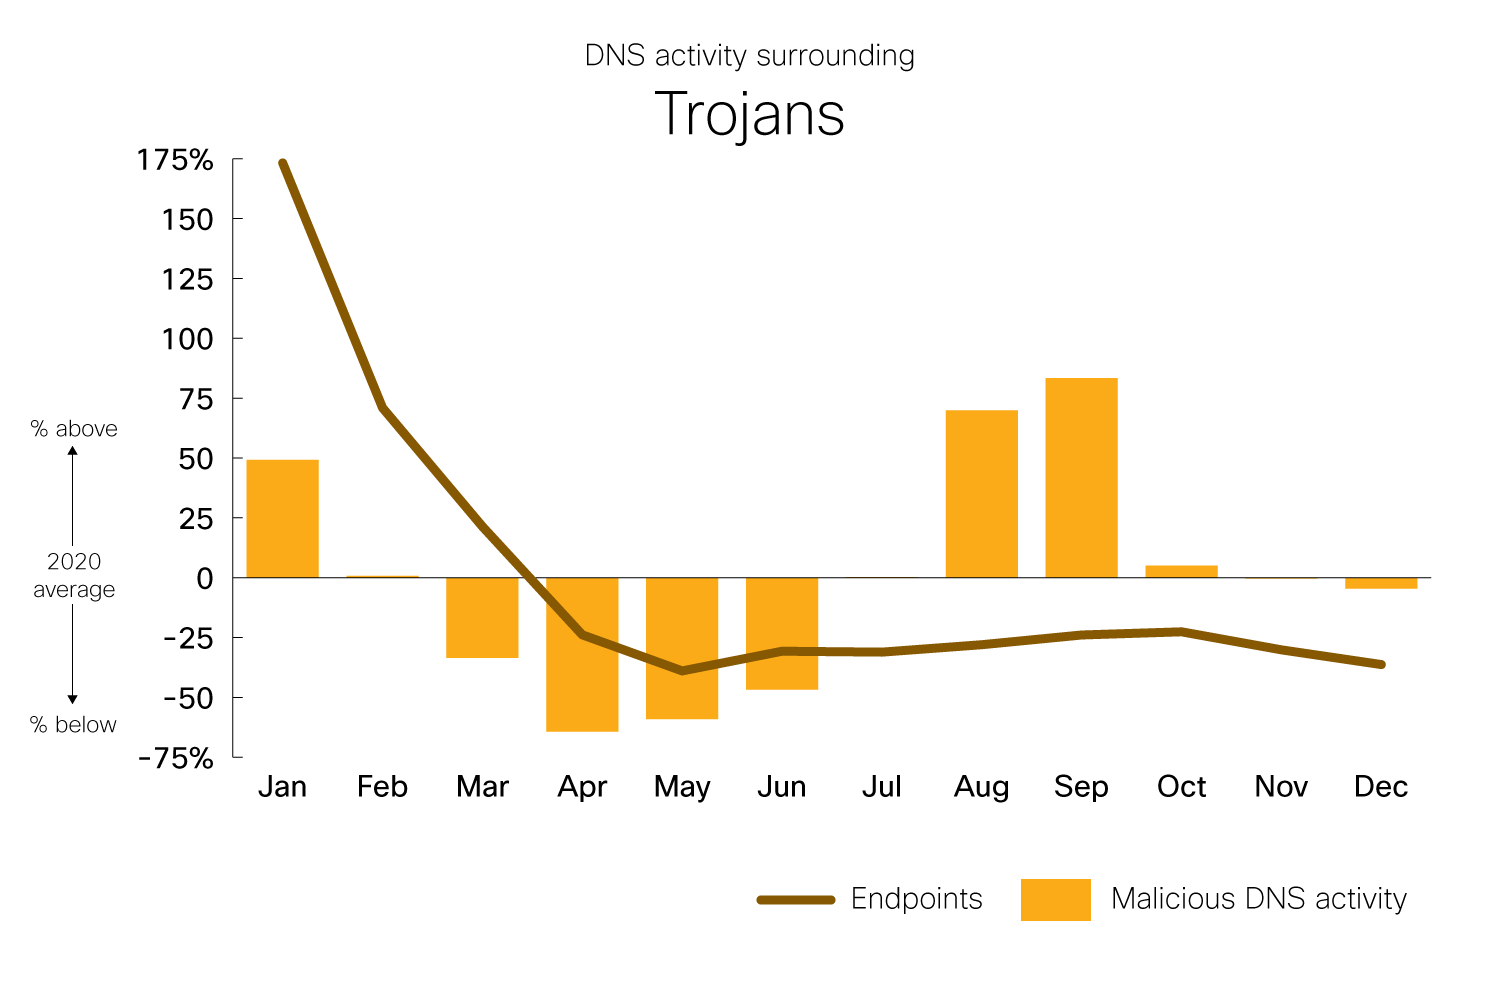
In late July, Emotet emerged from its slumber once again, comprising a massive amount of traffic that grew through September. This threat alone is responsible for the large increase in DNS activity from August through September. In all, 45 percent of organizations encountered Emotet.
Ransomware
For most of the year, two key ransomware threats dominated—one in breadth, the other in depth.
 Beginning in April, the number of computers compromised by Sodinokibi (a.k.a. REvil) increased significantly and continued to rise into autumn. The increase was significant enough that 46 percent of organizations encountered the threat. In September, overall queries from this particular ransomware family shot up to five times that of August, likely indicating that the ransomware payload was being executed across many of the impacted systems.

However, this is a drop in the bucket compared to the DNS activity of Ryuk, which is largely responsible for the November-December spike in activity. (It was so high that it skewed overall activity for the rest of the year, resulting in below-average numbers when it wasn’t active.) Yet the number of endpoints connecting to Ryuk-associated domains remained relatively small and consistent throughout the year, only showing modest increases before query activity skyrocketed.
So, while one threat corrals more endpoints, the other is much busier. Interestingly, this contrast between the two ransomware threats correlates with the amount of money that each threat reportedly attempts to extort from victims. Sodinokibi tends to hit a large number of endpoints, demanding a smaller ransom. Ryuk compromises far fewer systems, demanding a significantly larger payment.
Tying it all together
In today’s threat landscape, the idea that ‘no one is an island’ holds true for threats. The most prevalent attacks these days leverage a variety of threats at different stages. For example, let’s look at how Emotet is often delivered by phishing in order to deploy Ryuk as a payload. While the data below covers all phishing, Emotet, and Ryuk activity, as opposed to specific campaigns, a clear pattern emerges.
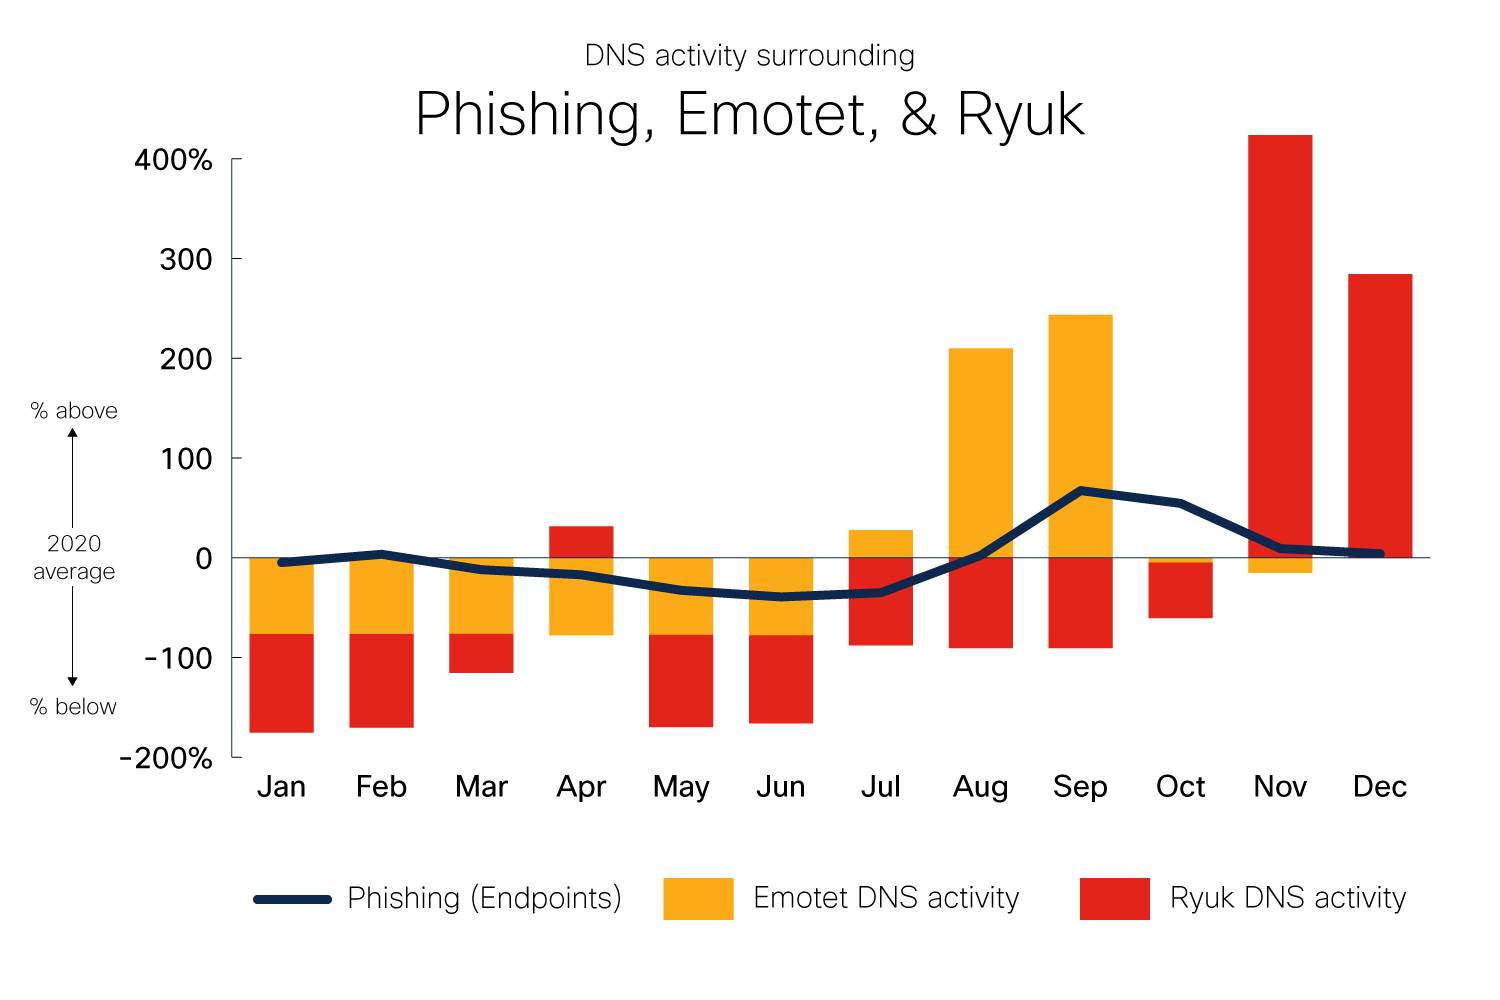 Remember the 102 percentage-point shift in phishing between July and September? This lines up with a 216 percentage-point jump in Emotet DNS activity. Activity drops off in October, followed by an eye-watering 480 percentage-point increase in Ryuk activity.
Emotet’s operations were significantly disrupted in January 2021, which will likely lead to a drop-off in activity for this particular threat chain. Nevertheless, the relationship presented here is worth considering, as other threat actors follow similar patterns.
If you find one threat within your network, it’s wise to investigate what threats have been observed working in tandem with it and take precautionary measures to prevent them from causing further havoc.
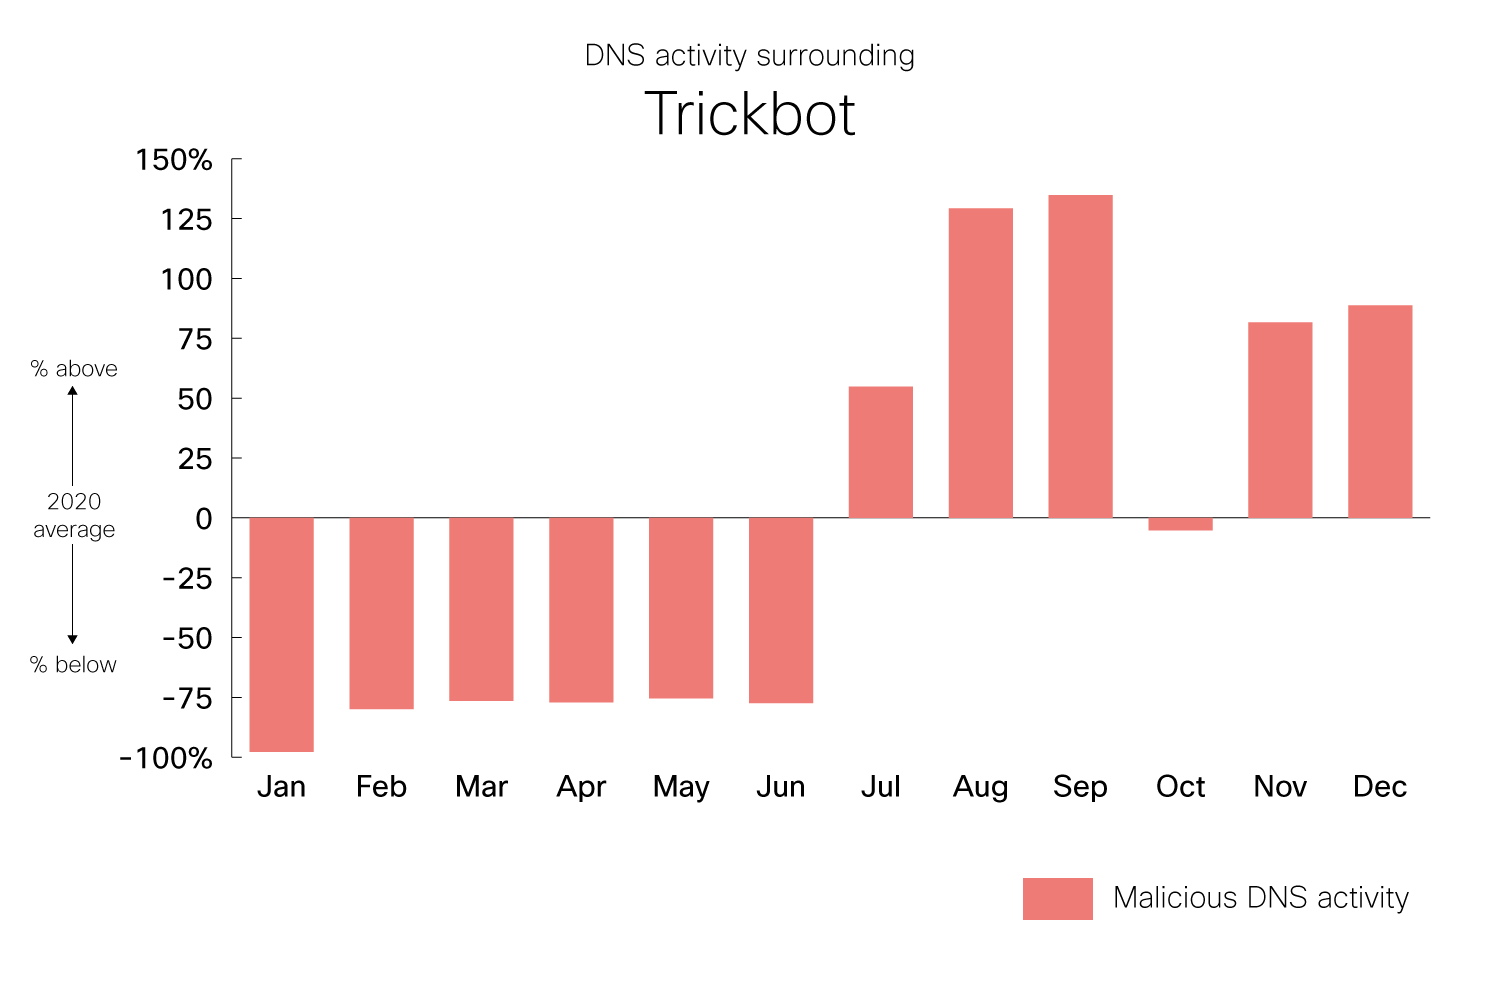
For example, if you find evidence of Ryuk, but not Emotet, it might be worth looking for Trickbot as well. Both Emotet and Trickbot have been seen deploying Ryuk in attacks, at times in coordination, and other times separately.
Sure enough, Trickbot follows a similar pattern in terms of DNS activity—lower in the first half of the year, busy in August and September, then quiet in October. However, Trickbot was active between November and December, when Emotet was not, likely contributing to the phenomenal increase in Ryuk activity during these two months.
 Preventing successful attacks
As mentioned earlier, the data used to show these trends comes from Cisco Umbrella, our cloud delivered security service that includes DNS security, secure web gateway, firewall, and cloud access security broker (CASB) functionality, and threat intelligence. In each of these cases, the malicious activity was stopped in its tracks by Umbrella. The user who clicked on a phishing email was unable to connect to the malicious site. The RAT attempting to talk to its C2 server was unable to phone home. The illicit cryptominer couldn’t get work to mine.
Umbrella combines multiple security functions into one solution, so you can extend protection to devices, remote users, and distributed locations anywhere. Umbrella is the easiest way to effectively protect your users everywhere in minutes.
Also, if you’re looking to get more information on the malicious domains that your organization encounters, Umbrella Investigate gives the most complete view of the relationships and evolution of internet domains, IPs, and files — helping to pinpoint attackers’ infrastructures and predict future threats. No other vendor offers the same level of interactive threat intelligence — exposing current and developing threats. Umbrella delivers the context you need for faster incident investigation and response.
Want to learn more?
Check out https://umbrella.cisco.com/ for more details.
Up next
In this blog we looked at the most active threat categories seen in DNS traffic, as well as how evidence of one threat can lead to uncovering others. In part two, we’ll break the data down further to examine which industries are targeted by these threats. Stay tuned to learn more about the impact on your industry!
Methodology
We’ve organized the data set to obtain overall percentages and month-on-month trends. We’ve aggregated the data by the number of endpoints that have attempted to visit certain websites that have been flagged as malicious. We’ve also aggregated the total number of times websites flagged as malicious have been visited. These numbers have been grouped into meaningful threat categories and, when possible, have been marked as being associated with a particular threat.
We’ve also applied filtering to remove certain data anomalies that can appear when looking at malicious DNS traffic. For example, when a C2 infrastructure is taken down, compromised endpoints attempting to call back to a sinkholed domain can generate large amounts of traffic as they unsuccessfully attempt to connect. In cases like these, we have filtered out such data from the data set.
The charts use a variation of the Z-score method of statistical measurement, which describes a value’s relationship to the mean. In this case, instead of using the number of standard deviations for comparison, we’ve shown the percent increase or decrease from the mean. We feel this presents a more digestible comparison for the average reader.
A word on privacy
Cisco takes customer privacy very seriously. To further this end, we’ve gone to great lengths to ensure that the data used for this blog series is anonymized and aggregated before any analysis is performed on it. While Cisco Secure products can report telemetry back to us, this is an opt-in feature.