

Preparing for Critical Infrastructure Changes in Australia
June 22, 2021
NetApp Acquires Data Mechanics to Accelerate Spot Roadmap and Optimize Data Analytics and Machine Learning Workloads in the Cloud
June 22, 2021TrustSec Policy Analytics – Part Three: Policy Validation

In Part One of the Cisco TrustSec Policy Analytics blog series, Samuel Brown spoke about the challenges associated with designing, implementing, and verifying security policies and introduced new reports in Cisco Secure Network Analytics that are designed to help accomplish these tasks. In Part Two, I dove deeper into the need for visibility and how to leverage some of these new reports – specifically the TrustSec Analytics report – in order to design and help implement security policies. In this post we are going to deep dive into the process of validating security policies and how the second report – the TrustSec Policy Analytics report – can help accomplish this task.
If you’ve been following along, you’re well aware that we ended part two with having conceptually arrived at a security policy that we could implement in the Cisco Identity Services Engine (ISE). In theory, this means that we might have been able to implement a TrustSec policy matrix similar to the one below, where we have not only implemented group assignments in the network, meaning that, as hosts come on and off the network, they are allocated to security groups, but have also applied controls between those security groups.

In Figure 1 you’ll note in the bottom left that it is marked as “Enabled” – meaning that the security policy is in production and being enforced. So now, as an administrator, we’re faced with the fundamental questions:
- Is my security policy being enforced as intended?
- Is my security policy correct?
The new TrustSec Policy Analytics report in Cisco Secure Network Analytics was purposefully built to help answer those questions.
Is my security policy being enforced as intended?
When we created the production TrustSec policy matrix in Figure 1 and deployed it, our intention was that the network would begin enforcing that policy. For example, in the above matrix we would have expected all IP traffic between the Employees Security Group and the Production_Bottling_Line Security Group to be denied. Likewise, all traffic between the Production_Bottling_Line and the Production_Users Security Groups would be subject to enforcement based on the “Bottling” Access Control List (ACL). In the TrustSec Policy Analytics report below in Figure 2, we’re able to quickly verify whether our policy is working as intended.

What differentiates the TrustSec Policy Analytics report, shown in Figure 2 above, from the TrustSec Analytics report (covered in part two of this series) is that we’ve overlayed a level of policy analysis, helping to answer the question, “Is the traffic being observed adhering to the policies in place?” So as before we can see the color-coded cells:
- Gray – no traffic
- Green – there is traffic and a permit IP ACL exists
- Red – there is traffic and a deny IP ACL exists
- Blue – there is traffic and a rule other than permit IP or deny IP exists
This provides us with a quick verification of what we think should be happening. But what differentiates the TrustSec Policy Analytics report from the TrustSec Analytics report is the addition of the orange triangle, which can be seen in some of the cells in Figure 2.
Given our objective in launching this report, our attention is immediately drawn to the red cells with orange triangles – two of specific interest jump out, as in the context of this organization I know these to be of interest:
- Employees to Production_Bottling_Line
- Employees to PCI_Servers

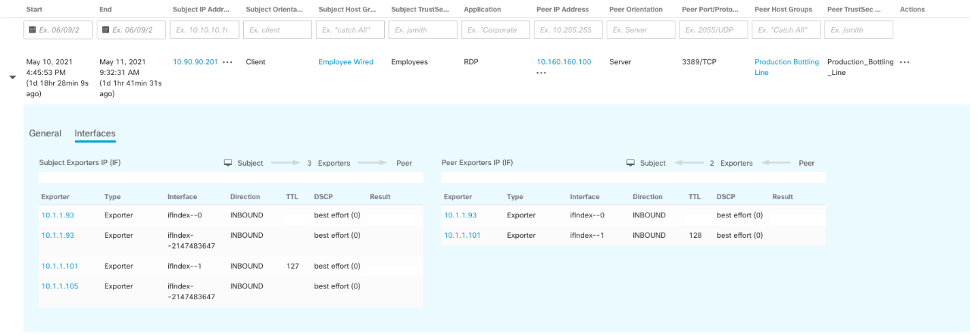
Selecting the cell with the source group Employees and the destination group Production_Bottling_Line yields Figure 3. We can quickly see that there has been round-trip traffic between the two groups, policy enforcement is enabled, and there is supposedly a “deny IP” ACL in place but yet there is a suspected policy violation indicator – that indicator is informing us that the traffic seen is not in compliance with the ACL in place for the cell. Clicking “Flow Search for Offending Traffic” will build and run a flow query, providing the entailments that triggered the notification (seen in Figure 4 below), and we can see that there is indeed a single RDP flow existing between the Employees source group and the Production_Bottling_Line destination group. We can also see all of the network interfaces that have reported telemetry about the flow so we can trace the path of the packet and identify why our “deny IP” policy wasn’t enforced. In this case it is likely that none of the exporters in the packet path were enabled to enforce TrustSec policy.
Selecting the other cell that jumped out at us earlier – the cell with the source group Employees and the destination group PCI_Servers – we notice that it has a red coloring but no orange triangle. What this is indicating to us, and we can confirm by looking at Figure 5 below, is that there was traffic observed from the source group Employees destinated to the destination group PCI_Servers, but there was no return traffic. Because there was no return traffic, the analytics in the report is concluding that policy is being adhered to and there are no suspected violations.

Is my security policy correct?
While the first fundamental question was more tactical, this one is a little bit more strategic: we’ve created policy, and assuming it’s being enforced, does it match our initial intent? In a way we’re repeating the analysis we performed in part two of this series on policy visualization, but because we’ve already created our policy hypothesis and put it in place, we’re instead evaluating whether our hypothesis is still true (i.e., is the policy we invented last week still true this week?). By implementing policy, we’ve also created a set of conditions for threat detection – traffic patterns that are not compliant with our policy are arguably indicators of compromise and may warrant investigation by our security operations teams.
In Figure 2 there is a third cell of immediate interest, a blue-colored cell with an orange triangle between the source security group of Production_Users and the destination group of Production_Bottling_Line. Recall that the blue color means that there is traffic and there is a custom ACL in place. Clicking on this cell in Figure 2 yields Figure 6 below, where we can see that there has been traffic between the two security groups and there is a suspected violation of the rules contained in the “Bottling” ACL.

Clicking “Flow Search for Offending Traffic” in Figure 6 yields Figure 7 below.

What we can observe in Figure 7 above is that there is a single ICMP flow existing between our Production_Users and Production_Bottling_Line security groups. The ACL in place disallows all non-TCP traffic (for reasons similar to what might have occurred in the first section of this post, the traffic might not be denied), but here we have evidence of an ICMP flow. So now we face the below decision tree and process:

Assuming that there is valid business justification to allow ICMP traffic between the Production_Users and the Production_Bottling_Line, we need to update the ACL in ISE accordingly, seen below in Figure 8.

In these examples I’ve quickly moved through the data and the analytical outcomes to help address the fundamental questions about the accuracy of the security policy in my organization – ensuring that my security policy is working as intended.
In this three-part series, we’ve briefly examined the approach of using data and analytics to design security policy and we’ve deep dove into two new reports in Cisco Secure Network Analytics to help make this job quicker and easier. To learn more:
Learn more about Cisco Secure Network Analytics.
Learn more about Cisco Identity Services Engine.
Learn more about Cisco Secure Network Analytics and see the new TrustSec Analytics reports in action.
Learn more about building security policy using data intelligence.
Don’t have Secure Network Analytics? Learn more by visiting www.cisco.com/go/secure-network-analytics or try the solution out for yourself today with a free visibility assessment.